Additional charts for the 2016 Industry Forecast
The January issue of Boating Industry featured the 2016 Industry Forecast.
In these charts, Info-Link offers further information that we couldn’t fit into print.
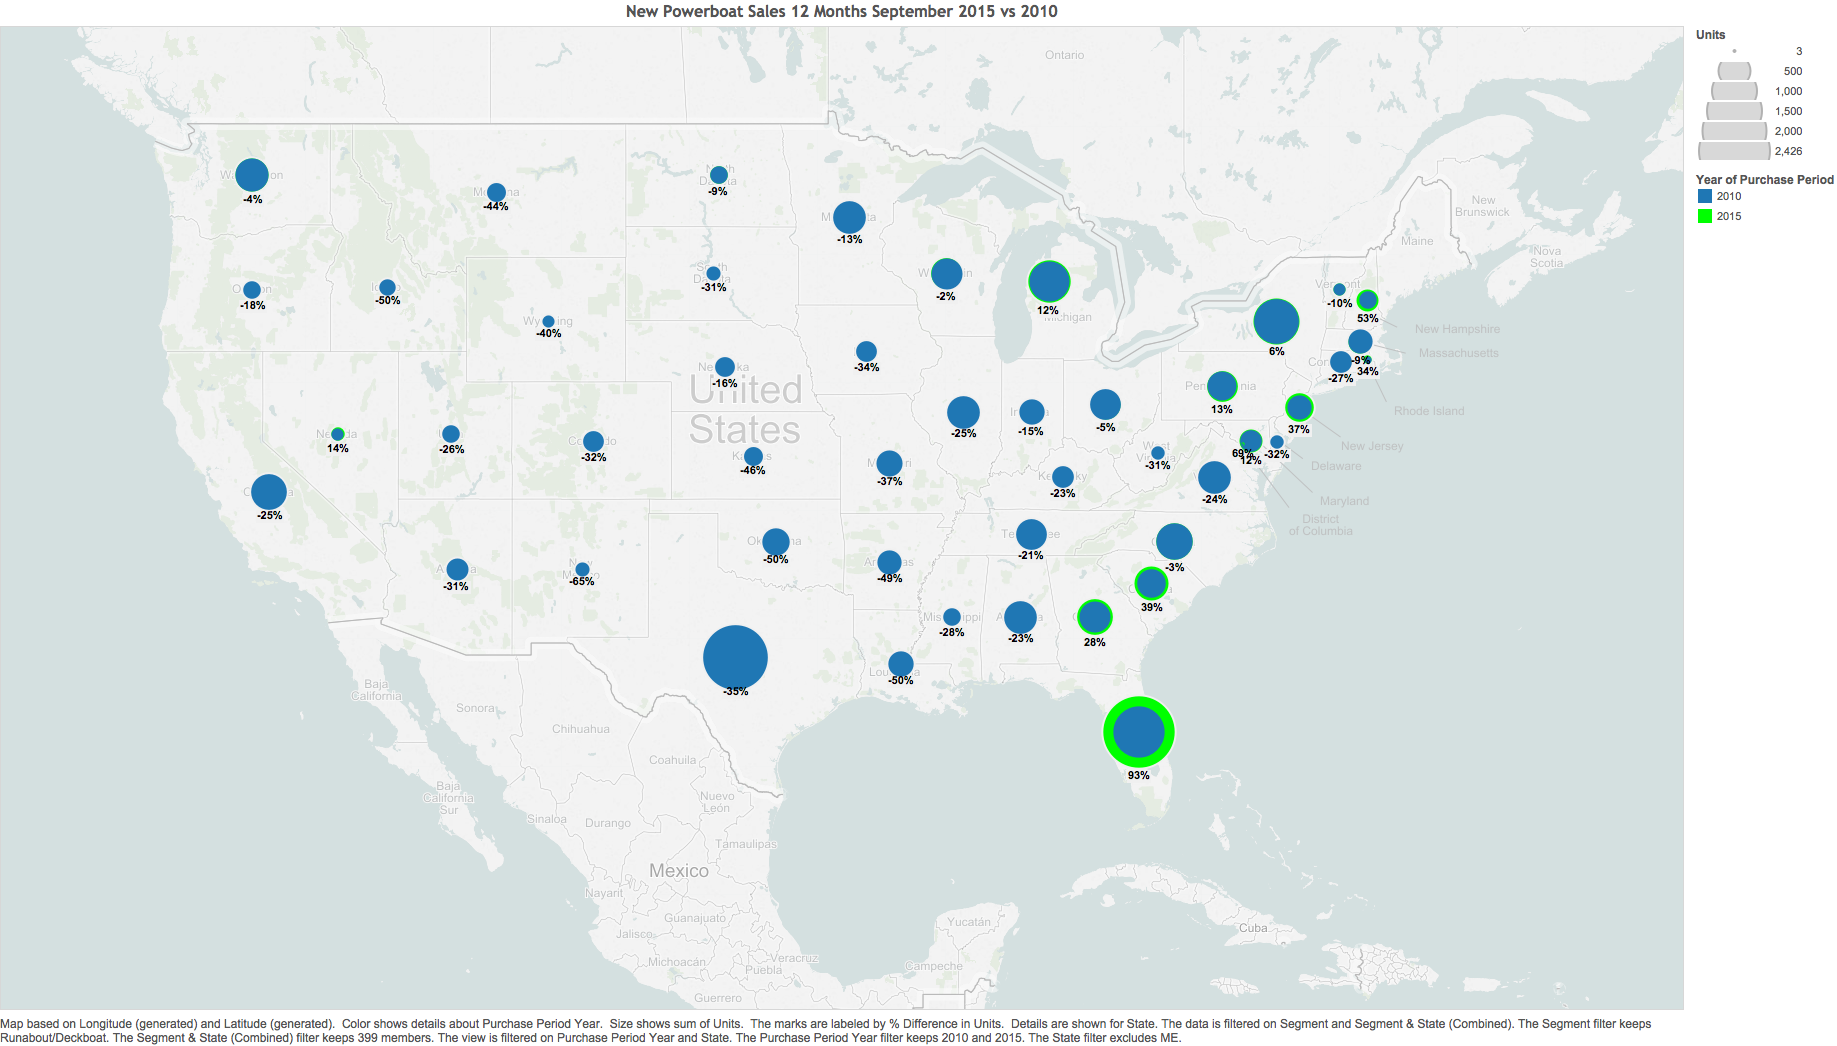
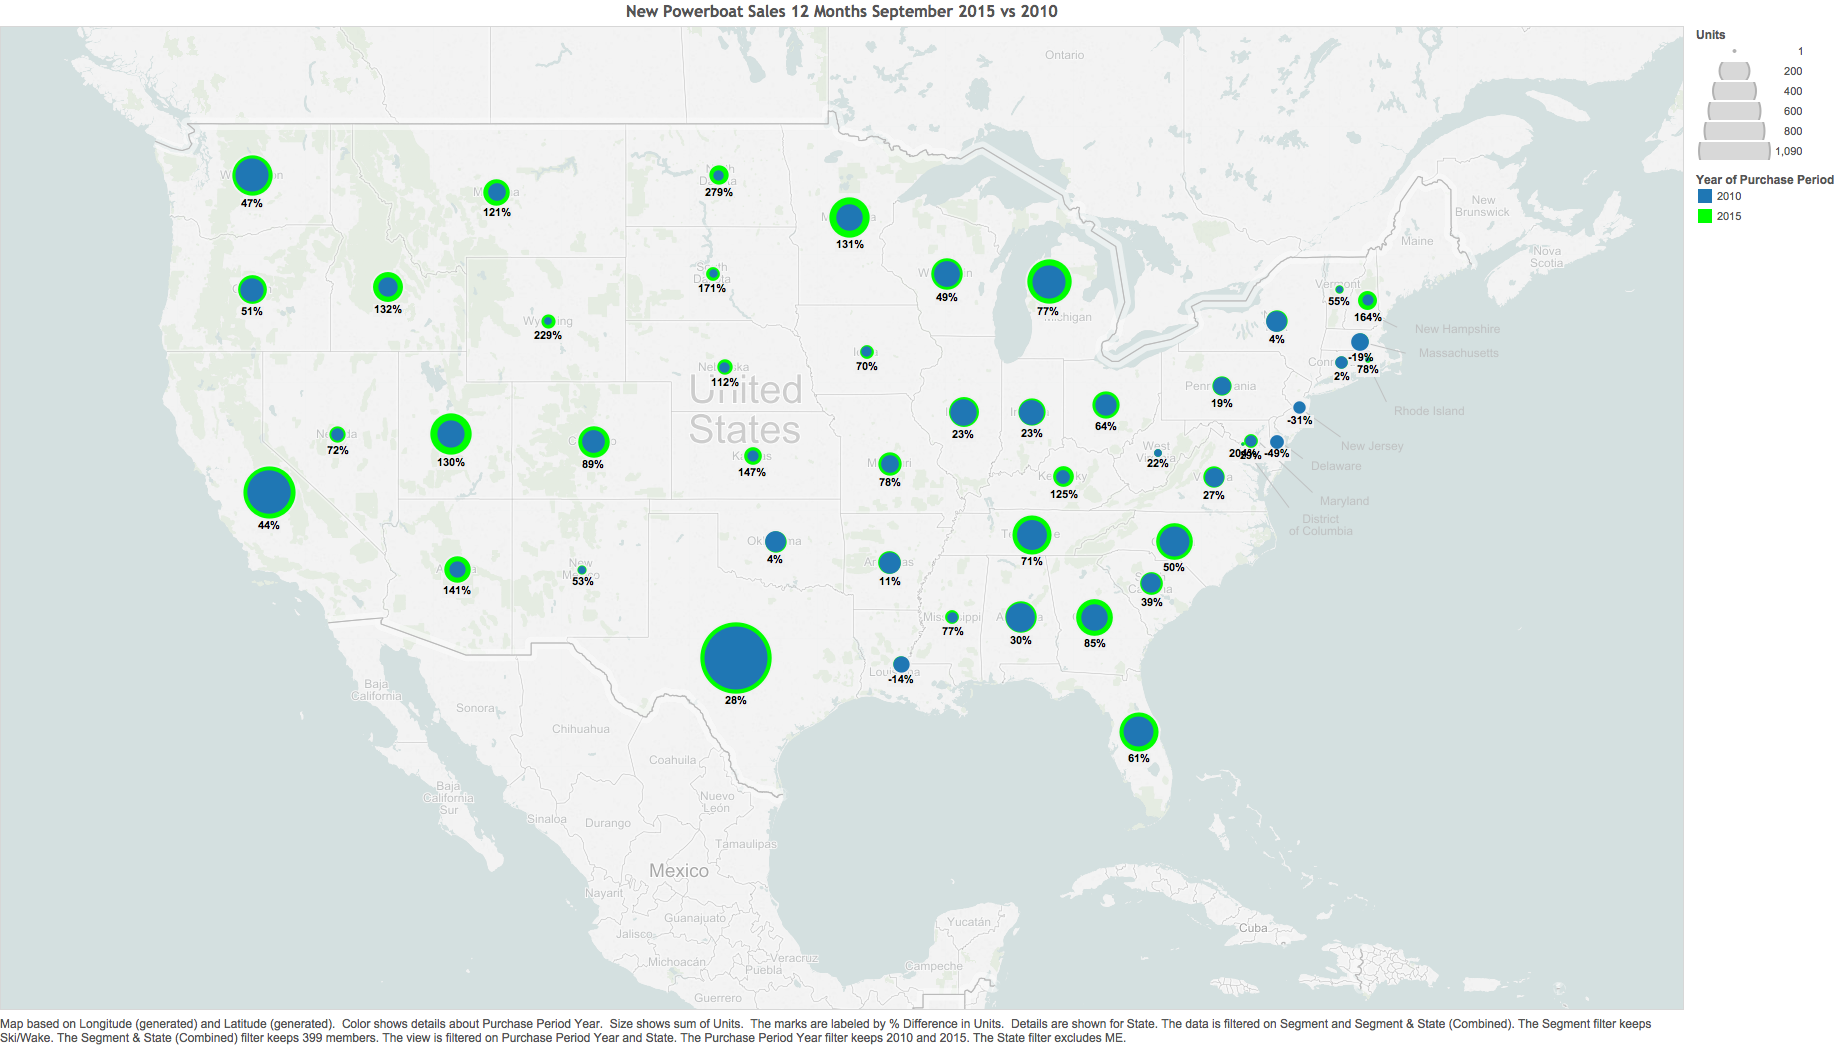
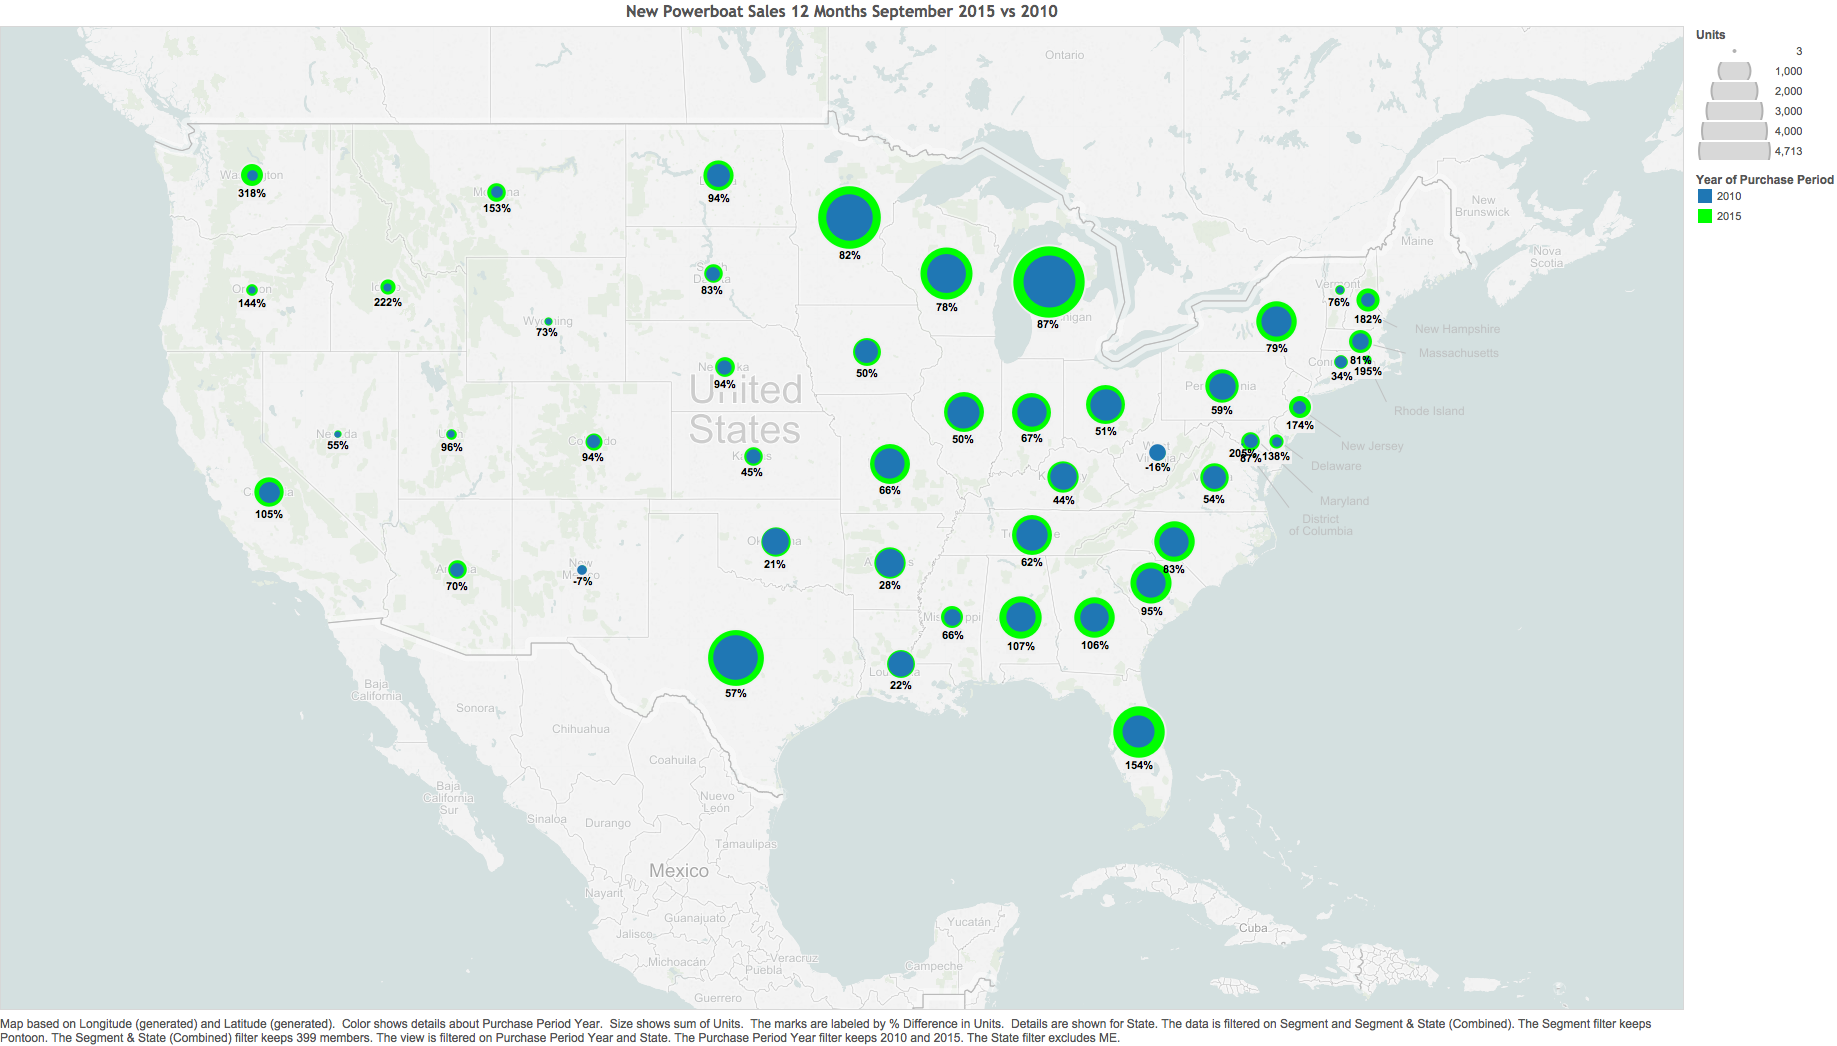
Some states are faring better than others in the recovery. These map, provided by Info-Link, show the increase in several categories in each state from 2010 to 2015. The first map shows pontoon sales, followed by runabout sales and, in the third map, ski/wake boat sales.